


Happy Easter!!

Beautiful Easter starts with morning services at St. Andrews, then whole family back to our house for lunch in the garden, followed by an egg hunt with Gracie getting the big haul.
From inventory to rates to prices, conditions are lining up in your favor.

If you’re like most people looking to list your home, you’re looking at the market weighing the right moment to move. As one of Southern California’s top real estate agents over the past three decades, I’ve been studying the market closely for years. And the trends are clear: the time to seize the market is now, before rates go up or price trends change. I’m here to help. If you have questions or concerns, let’s talk. Call me to schedule your complimentary, no-strings consultation.
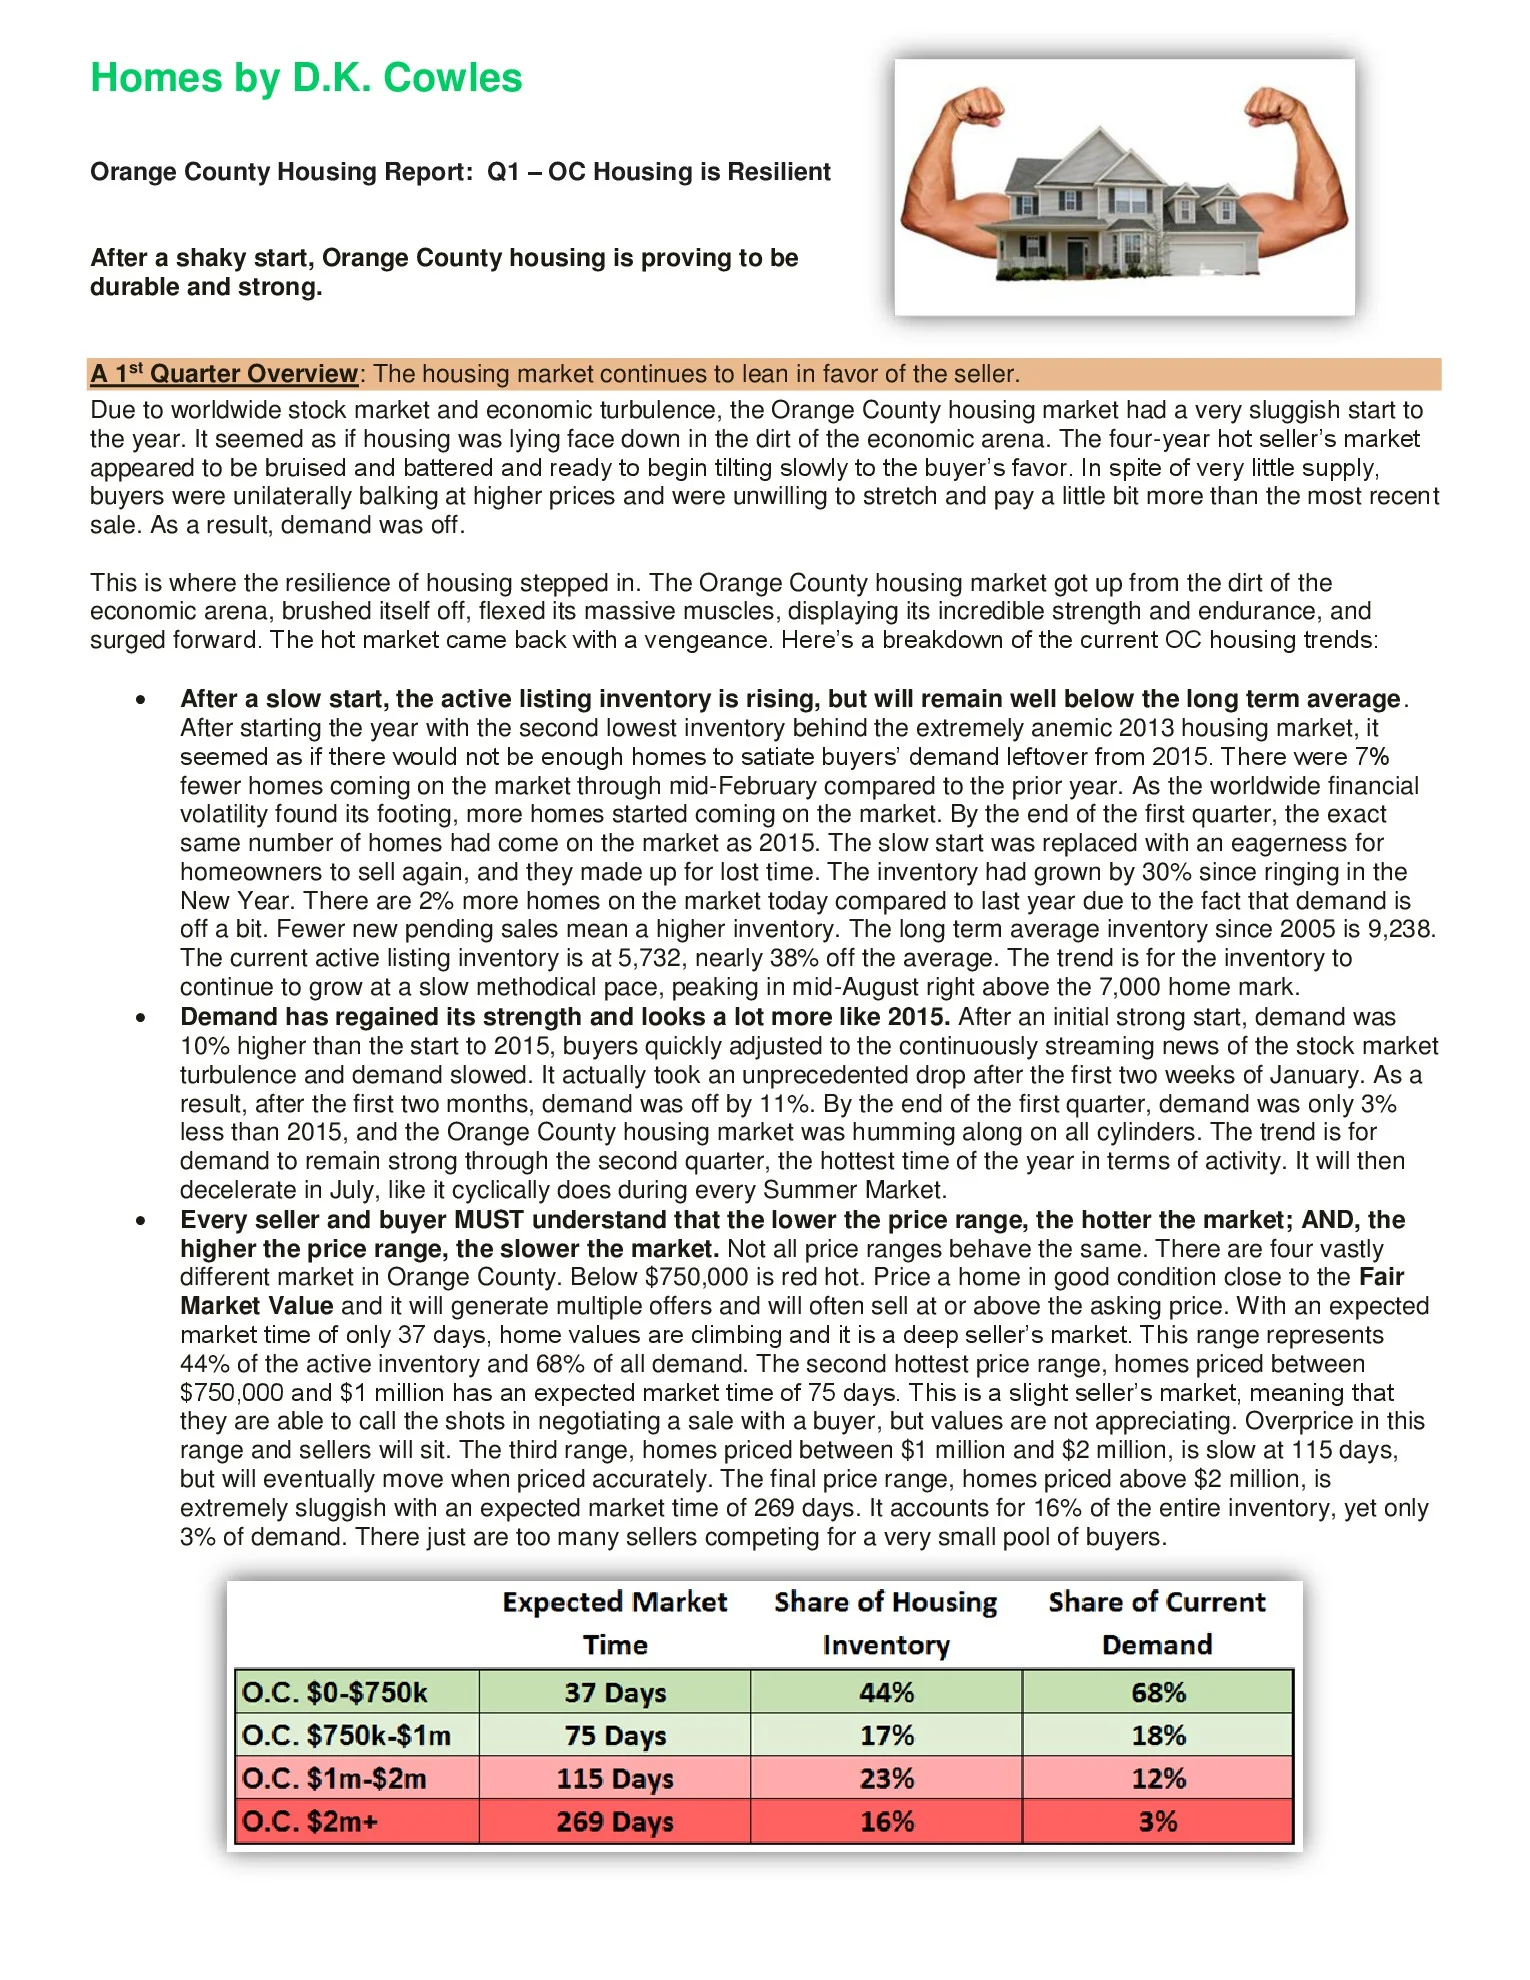
Orange County Housing Report: The Lower End is Shrinking

Mortgage Rates – The Time to Sell & Buy is Now
With mortgage rates reportedly on the rise, it is more important than ever to inform clients about how low mortgage rates still are compared to past years. Home buyers that decide to wait for rates to drop a mere quarter of a percent run the dangerous risk of seeing rates adjust back up to the historical averages and pricing themselves right out of the market. Also, home buyers and sellers often focus too heavily on home prices with very little thought about mortgage rates. They only concern themselves on the price they pay for a home, or the price that they are able to sell their home for. Mortgage rates become just an afterthought. Yet now more than ever rising mortgage interest rates should be more of a concern than rising home prices. After all, home sellers that wait a year for values to rise to get an extra $5,000 to $10,000 for their home may find themselves turning around to buy their next home with mortgage rates 1% to 2% higher by then. This would amount to paying an extra $50,000 to $100,000 over the life of a normal 30 year amortized loan. Which is precisely why the time to buy or sell a home is now.
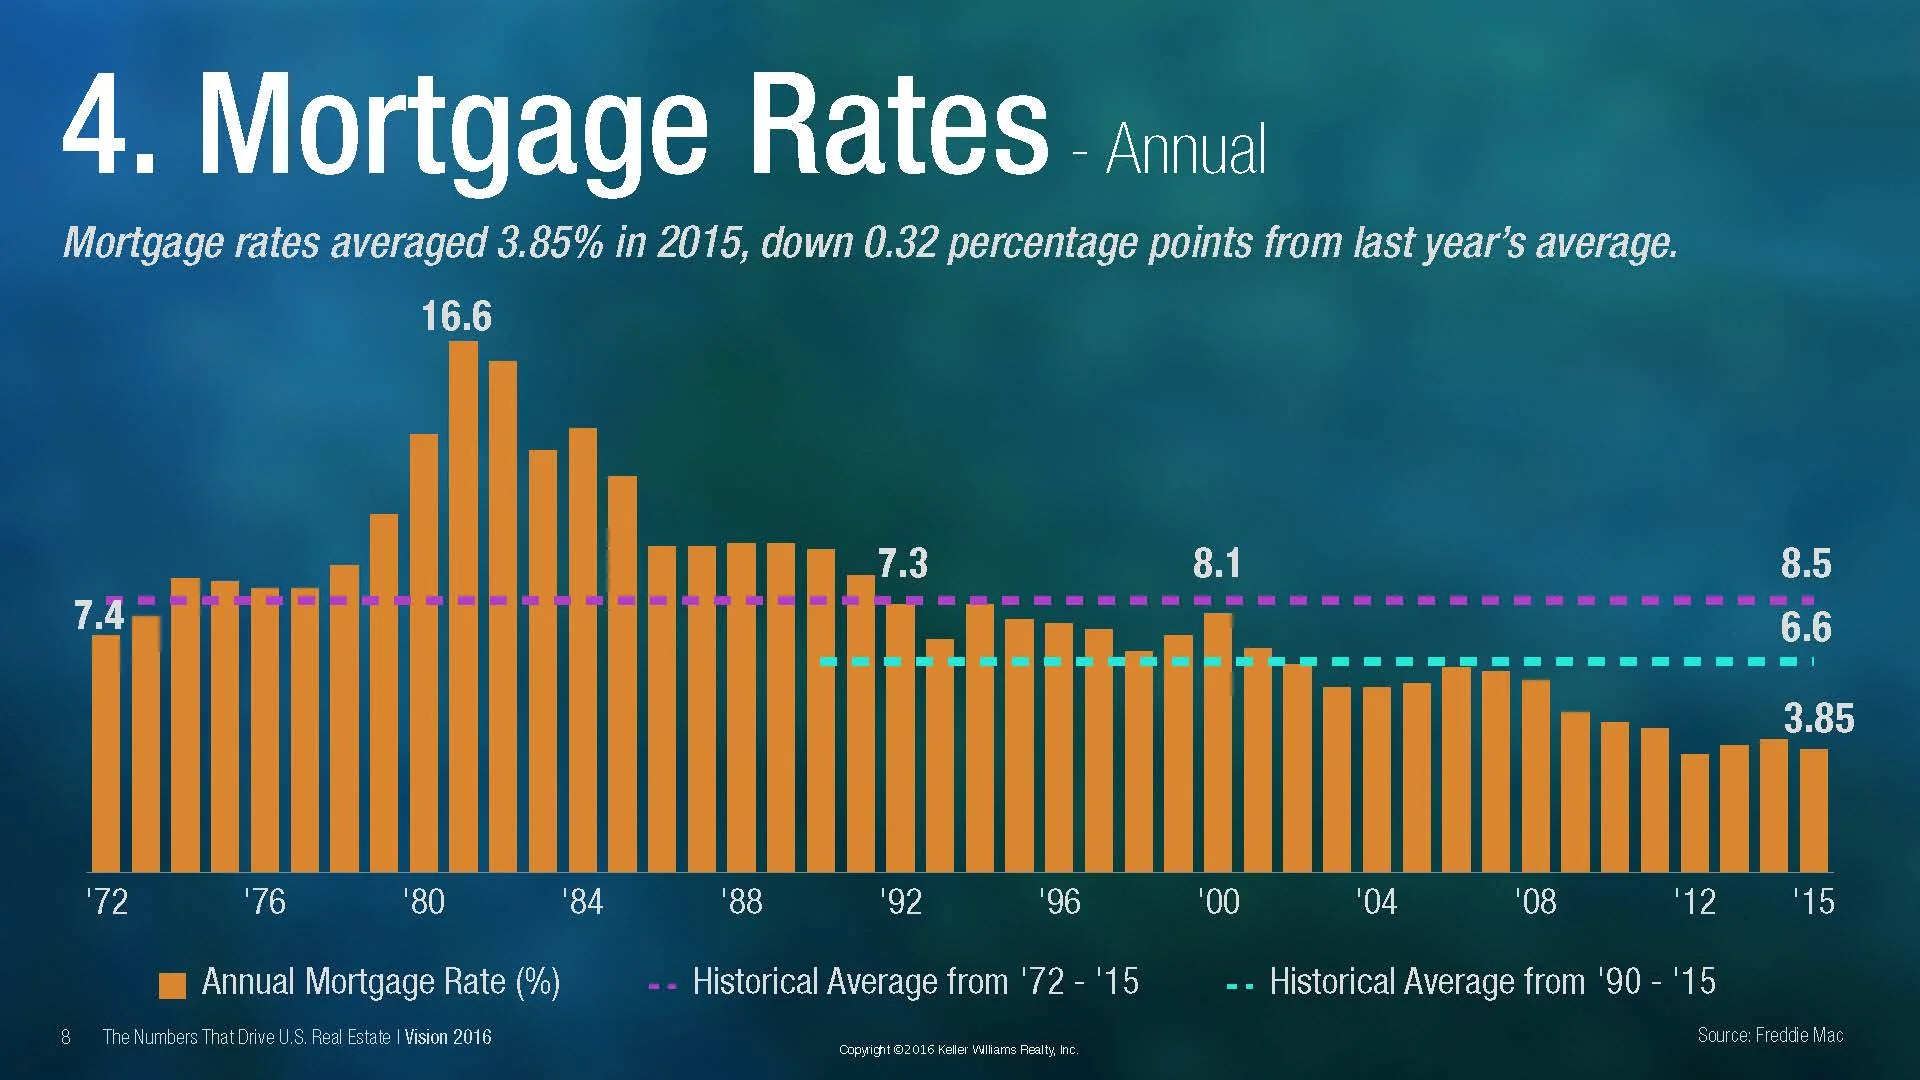
Annual Mortgage Rates
The infographic provided courtesy of Keller Williams Realty International illustrates that for more than 40 years the average mortgage rate has been 8.5% according to data provided by Freddie Mac. With average mortgage rates slowly trending up over the last 3 years, it is reasonable to assume that waiting to buy or sell poses a significant financial risk.
2015 price gains restore equity to 6,600 O.C. homes
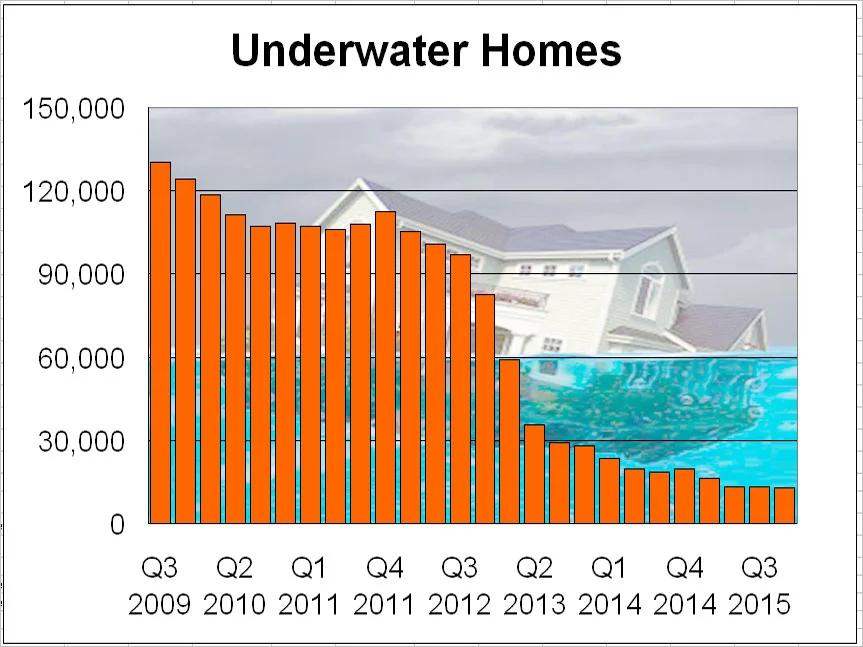
Rising home values helped lift 6,609 Orange County homes from being “under water” last year, meaning that their values no longer are less than what’s owed on their mortgages, Irvine-based CoreLogic reported Thursday.
During the fourth quarter of 2015, 12,930 O.C. homes were “under water,” or worth less than their mortgages. That’s down from more than 19,500 at the end of 2014.
“Higher prices driven largely by tight supply are certainly a big reason for the rise” of homes with equity, said CoreLogic President and CEO Anand Nallathambi. “But continued population growth, household formation and ultra-low interest rates are also factors.”
Equity is a property’s value above what’s owed on its mortgage. So if a home with a $500,000 mortgage is worth $550,000, it has $50,000 in equity.
But if it’s value is just $450,000, it’s under water because the owner owes $50,000 more than it’s worth.
The number of underwater homes soared during the housing crash because prices dropped below what owners owed their lenders.
At the height of the foreclosure crisis in 2009, 130,000 Orange County homes – more than one out of every five mortgaged residences – were worth less than their debt, CoreLogic figures show.
In the fourth quarter of last year, however, 2.4 percent of all Orange County homes with a mortgage – fewer than one in 40 – were under water.
By comparison, 4.5 percent of Los Angeles County’s mortgaged homes were under water in the fourth quarter.
More than 20 percent of homes still are under water in Miami and Las Vegas, two of the hardest-hit communities in the foreclosure crisis.
But less than 1 percent of the homes on the San Francisco Peninsula were under water in the fourth quarter.
Nationwide, 8.5 percent of homes were under water in the fourth quarter, or 4.3 million U.S. homes, CoreLogic reported. A million U.S. borrowers regained equity in their homes in 2015.
The real estate data firm reported that 5,274 Orange County homes had less than 5 percent equity at the end of last year. Even though those homeowners aren’t under water, selling is almost impossible since there wouldn’t be enough money to pay off the mortgage after closing costs.
Nationally, 1.2 million U.S. homeowners had less than 5 percent equity, CoreLogic reported.
“Looking ahead in 2016, we expect home equity levels to continue to build, which is a good thing for the long-term health of the U.S. economy,” Nallathambi said.
Grateful for the opportunity to give back to the community

Homes by D.K. Cowles is a proud supporter of the Newport Aquatic Center; A place where Health & Happiness meet!
House-hunt hurdle: Lower prices = fewer discounts
House hunters seeking bargains: Here’s some more depressing news.
You’ve seen all of the reports about the limited inventory of cheaper homes. For example, ReportsOnHousing shows 1,208 homes listed for $500,000 or less on Feb. 25 – down 24 percent from a year ago.
That kind of supply shortage means sellers don’t have to discount much to move a property in Orange County’s most affordable neighborhoods.
ReportsOnHousing author Steve Thomas has an intriguing analysis in his biweekly breakdown of selling information from broker-listing networks: the ratio of selling price to the last list price. These numbers translate to how much discounting a buyer can expect a seller to make to get a deal done.
I tossed January’s selling data into my trusty spreadsheet to see how the sale-to-list pricing ratio changes by level of home prices. When I ranked the 44 Orange County communities that Thomas tracks by average listing price, I found that the lower the price, the lower the discount.
In Orange County’s 15 most-affordable neighborhoods, January’s average selling price for existing housing was $448,000 – or 98.1 percent of the average list price. That means sellers conceded by $8,400, on average.
Contrast that to a countywide average of 97 percent, or a $24,000 cut. Worse, look at housing’s upper crust. The 15 priciest neighborhoods in Orange County had an average sales price of $1.26 million in January – or 96.1 percent of last listing price, a typical $49,000 price cut!
Look at the discounting extremes by community:
• Portola Hills house hunters had it worst, getting the smallest discounts in January and paying 99.5 percent of list price – or just a $2,500 price cut on an average sales price of $491,125.
• La Habra was next: Buyers paid 99.4 percent of list on an average sales price of $478,326. Then came Aliso Viejo at 99.3 percent of list on homes selling for $575,893.
At the other end of the spectrum, beach-town sellers had to bargain pretty hard.
Corona Del Mar buyers found the highest discounts with January sales running 92.3 percent of list price on a $3.3 million average sale – that translates to a typical $254,000 price cut!
Newport Coast was next: 94.4 percent of list with an average sales price of $1.88 million. Then came Dana Point at 94.5 percent of list with an average sales price of $1.68 million.
Like it or not, low-end house hunters have little time to ponder any discounts offered.
Consider Thomas’s expected market time data – counting how many days it would take to sell the current inventory of listed homes at the current pace of new escrows opening:
Neighborhoods with the cheapest sale prices in January started the year with average market time of 64 days – almost half of the 123 days required to sell a high-end home.
It’s no fun to be a bargain-seeking homebuyer these days. If you flinch at hard-line negotiating with sellers, you risk losing the deal.
First Time Home Owners

Congratulations Alex & Sarah on your new home. Very excited for you as a first time home buyer but also first time parents!! May you have many years of Joy, Love & Laughter as you turn your house into a home. Thank you for allowing Homes by D.K. Cowles to serve you.
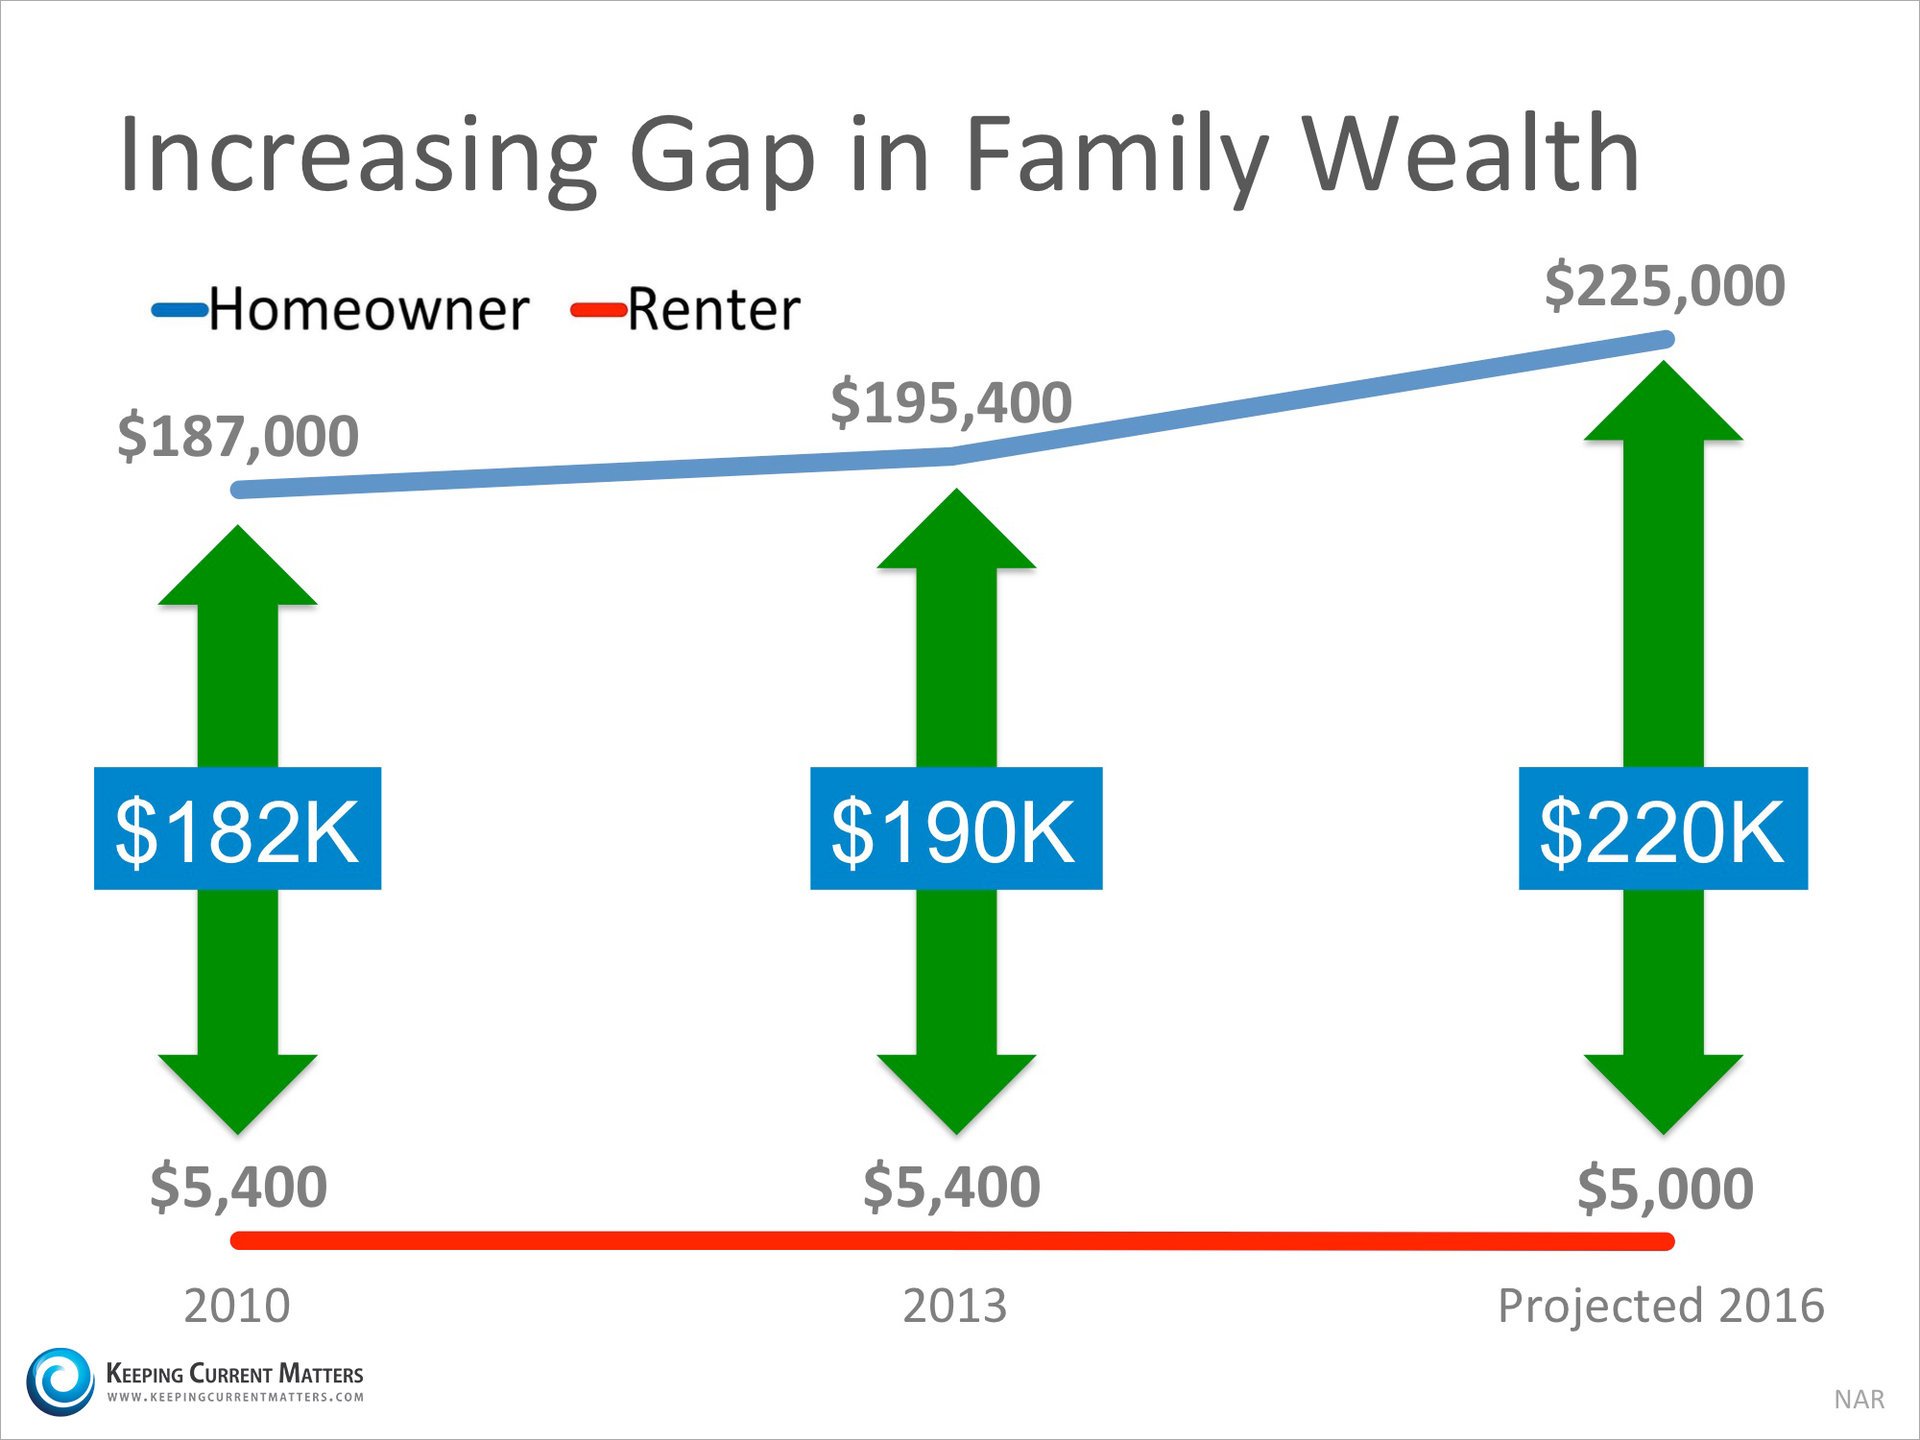
Homeowner’s Net Worth is 45x Greater Than a Renter’s

Every three years the Federal Reserve conducts a Survey of Consumer Finances in which they collect data across all economic and social groups. The latest survey, which includes data from 2010-2013, reports that a homeowner’s net worth is 36 times greater than that of a renter ($194,500 vs. $5,400).
In a Forbes article the National Association of Realtors’ (NAR) Chief EconomistLawrence Yun predicts that in 2016 the net worth gap will widen even further to 45 times greater.
The graph below demonstrates the results of the last two Federal Reserve studies and Yun’s prediction:

Put Your Housing Cost to Work For You
Simply put, homeownership is a form of ‘forced savings’. Every time you pay your mortgage you are contributing to your net worth. Every time you pay your rent, you are contributing to your landlord’s net worth.
The latest National Housing Pulse Survey from NAR reveals that 85% of consumers believe that purchasing a home is a good financial decision. Yun comments:
“Though there will always be discussion about whether to buy or rent, or whether the stock market offers a bigger return than real estate, the reality is that homeowners steadily build wealth. The simplest math shouldn’t be overlooked.”
Bottom Line
If you are interested in finding out if you could put your housing cost to work for you by purchasing a home, please contact me for your free consultation.